
The Johns Drowsiness Scale (JDS™) is a validated neurological biomarker that scores a person’s impairment from drowsiness on a scale of 0 to 10, derived entirely from the movements of their eyelids. It was developed by Optalert founder Dr. Murray Johns, the sleep scientist who also created the Epworth Sleepiness Scale (ESS), and it is the measure that underpins every Optalert system that measures drowsiness.
This page explains what the JDS measures, how it is calculated, what its scores mean operationally, and how it compares with the alternatives available to engineers building driver monitoring systems.
What the JDS measures
Most approaches to drowsiness detection measure how a person looks, how they behave, or how they say they feel. The JDS measures none of those things. It measures impairment: the increase in relative risk of a performance failure.
A performance failure is a specific, observable event: Failing to respond to a visual stimulus, drifting out of a lane, missing a stop signal, or failing to turn the wheel through a bend. A drowsiness-related accident occurs when a performance failure coincides with a moment that required a safety-critical action. What an operation needs to know is not whether a driver looks tired. It is how much more likely that driver is, right now, to fail to act.
The signal the JDS uses to answer that question is the movement of the eyelids. Eyelid movements are controlled by the same neurological pathways that govern alertness, which makes them a direct window into cognitive state rather than a proxy for it.
How the score is calculated
 The JDS is a composite scale. It draws on 64 mathematical parameters extracted from the eyelid signal, such as the velocity and duration of eyelid movement during blinks, the characteristics of eyelid closure, and the short-term variability in both, and tracks them over time, producing an updated score every minute.
Two properties matter more than the parameter count:
- It requires no individual calibration. The weighted combination of ocular parameters produces a single sensitive measure that does not need adjustment per person. A JDS of 4.5 means the same thing for every driver.
- Its predictive power holds across populations. Validity has been demonstrated across ages, genders, and ethnicities.
In Optalert’s wearable systems, an infrared LED and sensor built into the glasses frame measure eyelid movement 500 times per second. The same algorithm has since been applied to RGB-IR camera systems in vehicle cabins, which capture eyelid aperture at considerably lower sampling rates.
What JDS scores mean
The scale runs from 0 to 10, where 0 is very alert and 10 is very drowsy. The relationship between score and risk is not linear: risk rises slowly through the lower range and then climbs sharply.
| JDS score | Risk band | What it indicates |
|---|---|---|
| 0.0 – 3.0 | Low | Alert. Risk of performance failure is at or near baseline. |
| 3.0 – 4.4 | Low | Risk begins to rise, but only slightly. Useful as an early trend signal. |
| 4.5 – 4.9 | Medium | Risk increases substantially. The point at which intervention becomes worthwhile. |
| 5.0 – 10.0 | High | Risk of performance failure is 10 times higher than for an alert driver. |
The practical value of this structure is that it gives an operation a graded signal rather than a binary alarm. A supervisor can see a driver trending toward 4.5 and act before the score reaches 5.0, which is the difference between pre-emptively managing risk and reacting to it.
Who developed the JDS
The JDS was developed by the late Dr. Murray Johns, a sleep scientist and founding director of Optalert. In 1990 he created the Epworth Sleepiness Scale (ESS), which remains a world standard instrument for assessing a person’s general level of sleepiness in daily life and is used in sleep clinics internationally.
The ESS measures habitual sleepiness through self-report. The JDS was built to answer a different question: How impaired is this person at this moment, measured objectively? Getting there took more than two decades of research into the physiological expression of drowsiness.

An intermediate step in that work was the Johns Test of Vigilance (JTV™), a laboratory-based psychomotor vigilance test. Every element of it (the timing of stimuli, the size and colour contrast of the visual elements) was tuned to detect the specific form of cognitive failure that drowsiness produces. The JTV isolates that breakdown in the laboratory; the JDS detects it in the field. The JDS was initially modelled on the JTV, then refined by tracking actual performance failures in drivers.
No technology other than Optalert’s JDS provides a method for quantifying the relative risk of performance failure in drivers, especially at its early stages.
Dr. Murray Johns
JDS compared with the Karolinska Sleepiness Scale
The Karolinska Sleepiness Scale (KSS) is the most widely used reference measure in driver monitoring, and the most common alternative to the JDS. It asks a subject to rate their own sleepiness on a 9-point scale, from 1 (extremely alert) to 9 (very sleepy, great effort to keep awake, fighting sleep).
The two scales measure fundamentally different things. The KSS measures tiredness, which is a subjective feeling. The JDS measures impairment, which is an objective state.
| JDS | KSS | |
|---|---|---|
| What it measures | Impairment: relative risk of performance failure | Subjective feeling of sleepiness |
| Source of data | Eyelid movements, measured continuously | Self-report, at the moment of asking |
| Range | 0–10, updated every minute | 1–9, point-in-time |
| Stable over time? | Yes: no individual calibration required | No: one person’s “7” varies between occasions |
| Works when the subject is impaired? | Yes: measurement is independent of self-awareness | Degrades: the ability to self-assess is itself impaired |
| Suitable for real-time intervention? | Yes | No: requires interrupting the driver |
The KSS has a structural weakness that no amount of refinement resolves: as a person becomes more impaired, their capacity to accurately judge their own state degrades at the same time. Self-report is least trustworthy precisely when the measurement matters most. Furthermore, the mere act of asking a person their KSS score rouses them and counteracts drowsiness, thus interfering with its natural progression: two-way conversation is one of the most effective countermeasures to drowsiness.
Other approaches, and why they fall short
PERCLOS measures the percentage of time the eyes are at least 80% closed. It generally rises only during the late stages of drowsiness, by which point the driver is already dangerously impaired, so it cannot pre-empt a high-risk situation. Microsleeps can also occur while the eyes remain open, which PERCLOS will not register at all.
Electroencephalography (EEG) measures electrical activity in the brain directly. It is a strong laboratory measure but impractical in a vehicle, since it normally requires electrodes attached to the scalp. EEG-based detection systems in vehicles therefore estimate EEG signals from a non-invasive sensor rather than measuring them.
Yawn detection and head pose are behavioural proxies. Yawning correlates poorly with impairment and occurs for reasons unrelated to drowsiness, which makes it an unreliable trigger for intervention.
The validation evidence
A 2010 validation study involving researchers from Harvard Medical School, published in Sleep, concluded that real-time drowsiness measured by infrared reflectance oculography is “commensurate with gold standard laboratory measures”.1
In a 2023 study published in the Journal of Sleep Research by a team at the Institute for Breathing and Sleep, subjects were kept awake for 32 to 34 hours before completing a two-hour drive on a closed-loop track.2 Comparing the two ground truths against observed lane departures:
| Measure | Prediction errors | False alert rate | Specificity | AUC |
|---|---|---|---|---|
| JDS | 4% | 6% | 94% | 0.99 |
| KSS | 12% | 18% | 82% | 0.93 |
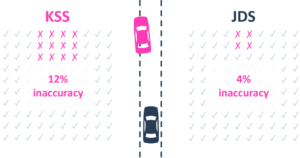
The JDS predicted lane departures with a third of the errors of the KSS, and generated a third as many false alerts. That second figure matters commercially as much as the first: A system that cries wolf gets ignored, and then switched off.
The JDS has also been adopted as an outcome measure by researchers with no commercial interest in it. A 2016 study in the Proceedings of the National Academy of Sciences, led from Brigham and Women’s Hospital and Harvard Medical School, used the JDS alongside electroencephalography and electrooculography to quantify how night-shift work degrades driving. Sixteen night-shift workers drove a closed track twice, once after normal sleep and once after a night shift. Mean JDS rose from 0.97 to 1.71, lane excursions from 1.49 to 3.09 per minute, and 37.5% of post-shift drives produced a near-crash against none after normal sleep.4
Beyond driver monitoring, Optalert has worked under contract with NASA and the British Airline Pilots Association, both of which required objective measurement of drowsiness.
The measurement approach has also been applied outside driver monitoring, in pharmaceutical and clinical research where drowsiness is either a deliberate outcome or a side effect under investigation. A 2008 study published in Psychopharmacology, co-authored by Optalert founder Dr. Murray Johns with researchers at Swinburne University, used infrared reflectance oculography to detect measurable changes in alertness following caffeine ingestion in well-rested subjects.3
Using the JDS for EU GSR compliance
For automotive engineers, the JDS has a specific regulatory application.
Under the EU General Safety Regulation (EU) 2021/1341, a Driver Drowsiness and Attention Warning (DDAW) system may issue a warning at a KSS level of 7 and must issue one at a KSS level of 8 or above. Critically, the regulation permits alternative measurements to the subjective KSS, provided there is evidence that the alternative is valid and accurate.
There is a linear relationship between the KSS and the JDS. The two regulatory thresholds map as follows:
| Regulatory threshold | KSS level | Equivalent JDS |
|---|---|---|
| Optional early warning | 7 | 4.3 |
| Mandatory alert | 8 | 5.9 |
This mapping means a DDAW system built on eyelid movement can be validated against the requirements of (EU) 2021/1341 without running a subjective KSS study, and Optalert can supply the evidence of equivalency that the regulation requires.
It is important to note that these values sometimes decouple, because the KSS is a subjective measurement of tiredness. It is not uncommon for a person to report a high KSS when they are unimpaired, or a low KSS when they are impaired. The JDS measures a person’s objective impairment; the KSS measures how tired a person feels.
Frequently asked questions
What is the Johns Drowsiness Scale?
The Johns Drowsiness Scale (JDS) is a validated biomarker that scores impairment from drowsiness on a 0 to 10 scale, calculated from 64 parameters derived from a person’s eyelid movements and updated every minute. It was developed by Dr. Murray Johns, the creator of the Epworth Sleepiness Scale.
What does a JDS score of 5 mean?
A JDS score of 5.0 or above indicates high risk. At this level the likelihood of a performance failure (such as a lane departure or a failure to respond to a stimulus) is 10 times higher than for an alert driver. Risk begins rising slightly above 3.0 and increases substantially from 4.5.
What is the difference between the JDS and the KSS?
The JDS objectively measures impairment from eyelid movements. The KSS is a 9-point self-report scale measuring how sleepy a person feels. Because the ability to self-assess degrades as impairment increases, the KSS becomes less reliable exactly when accuracy matters most. In a 2023 closed-track study, the JDS predicted lane departures with a third of the errors of the KSS.
Who invented the Johns Drowsiness Scale?
the late Dr. Murray Johns, a sleep scientist and founding director of Optalert. He also developed the Epworth Sleepiness Scale in 1990, which is used as a standard instrument in sleep clinics worldwide.
Can the JDS be used to meet EU GSR requirements?
Yes. Regulation (EU) 2021/1341 permits alternatives to the KSS where they are shown to be valid and accurate. The KSS thresholds of 7 and 8 map to JDS values of 4.3 and 5.9, allowing a DDAW system to be validated against the regulation using eyelid movement data.
Does the JDS need to be calibrated for each driver?
No. The weighted combination of ocular parameters produces a measure that does not require individual adjustment, and its predictive validity has been demonstrated across ages, genders, and ethnicities.
How is the JDS measured in a vehicle?
Through eyelid movement. In Optalert’s wearable systems an infrared LED and sensor in the glasses frame sample at 500 Hz. In vehicle cabins, the same algorithm runs on eyelid aperture data captured by an RGB-IR camera in the driver monitoring system at lower frame rates.
References
- Anderson C, et al. Real-time drowsiness as determined by infrareflectance oculography is commensurate with gold standard laboratory measures: a validation study. Sleep. 2010;33.
- Cori JM, Wilkinson VE, Soleimanloo SS, Westlake J, Stevens B, Rajaratnam SMW, Howard ME. A brief assessment of eye blink drowsiness immediately prior to or following driving detects drowsiness related driving impairment. J Sleep Res. 2023 Jun;32(3):e13785. doi:10.1111/jsr.13785. PMID: 36478313.
- Michael N, Johns M, Owen C, Patterson J. Effects of caffeine on alertness as measured by infrared reflectance oculography. Psychopharmacology (Berl). 2008 Oct;200(2):255-60. doi:10.1007/s00213-008-1202-z. PMID: 18537025.
- Lee ML, Howard ME, Horrey WJ, Liang Y, Anderson C, Shreeve MS, O’Brien CS, Czeisler CA. High risk of near-crash driving events following night-shift work. Proc Natl Acad Sci USA. 2016;113(1):176-181. doi:10.1073/pnas.1510383112
Measuring the right thing
Every drowsiness detection system rests on a choice about what to measure. Systems built on behaviour detect drowsiness once it is visible. Systems built on self-report detect it once the driver notices. The JDS was developed to detect impairment before either of those things happen, because that is the only point at which an intervention can still prevent the failure.
Contact Optalert to discuss validating your driver monitoring system against the JDS, or to request the technical evidence behind the figures on this page.